

Land and engineering surveyors based in Lancashire
Mobile Mapping Surveys
Mobile Mapping Surveys Lancashire and the North West
High-speed, High-accuracy 3D Data Capture. At Road Speed.
High-speed, High-accuracy 3D Data Capture. At Road Speed.
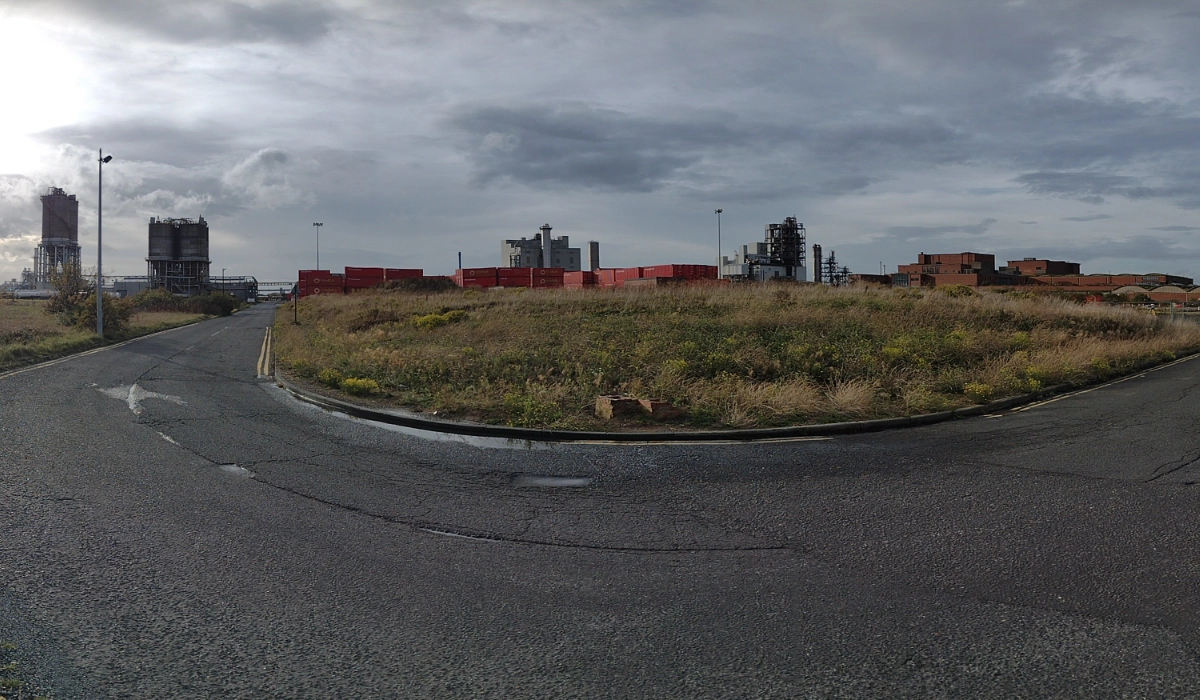
There is a category of survey that conventional methods handle badly. The live carriageway that cannot be closed for the time a static survey team would need. The long highway corridor where setting up a total station at hundreds of positions would take weeks. The urban street where a pedestrian survey team would create a safety risk and a traffic management cost that exceeds the survey fee. The road asset inspection that needs to cover fifty kilometres in a day.
These are not edge cases. They are the everyday reality of highways survey in the North West — and they are exactly the environment the CHCNAV AU20 Mobile Mapping System was designed for.
Site Surveying Services now operates the CHCNAV AU20 MMS — a vehicle-mounted LiDAR platform that captures 2 million points per second at 5mm accuracy while travelling at road speed. Complete, survey-grade 3D data of the full corridor — captured from a moving vehicle, with minimal carriageway presence, in a fraction of the time any static survey method requires.
For highways engineers, infrastructure asset managers, local authorities and tier 1 contractors working on live road schemes and asset management programmes — this is the survey methodology your programmes have been waiting for.

What is mobile mapping?
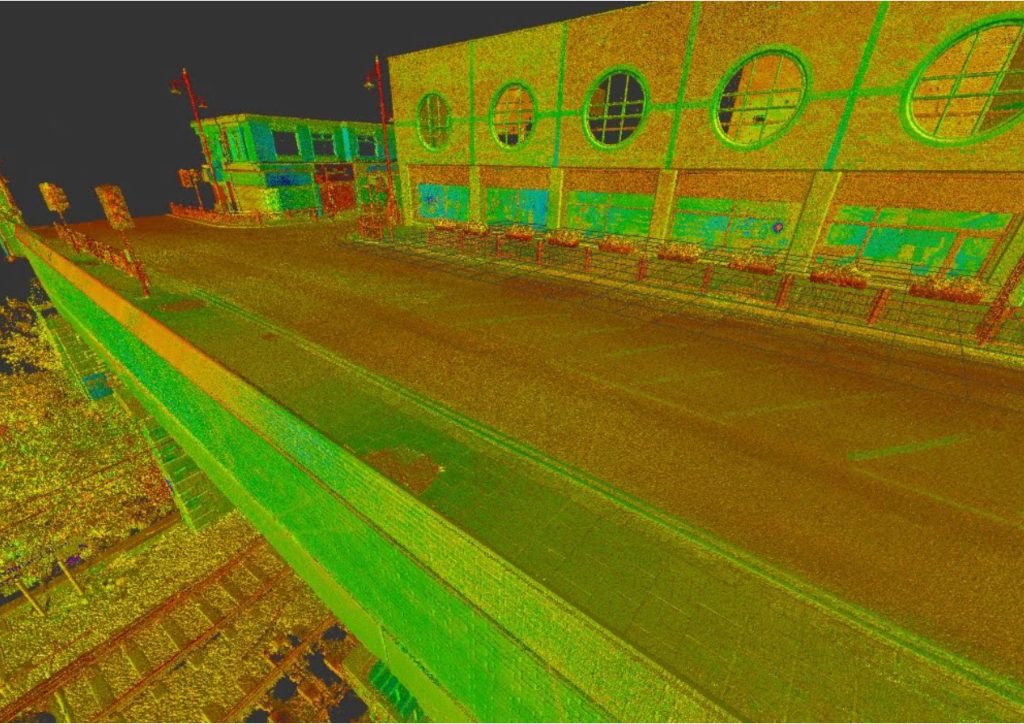
Mobile mapping is vehicle-mounted survey. A purpose-built platform combining LiDAR scanners, panoramic cameras, GNSS receivers and an inertial measurement unit is mounted on a survey vehicle. As the vehicle travels along the survey corridor at normal road speed, the system captures a continuous, 360° point cloud and high-resolution photographic record of everything within range — simultaneously, without stopping.
The result is a dense, colourised, georeferenced 3D dataset of the full corridor — road surface, kerbs, drainage, signage, street furniture, boundaries, verges, structures and all features within the scan range — captured from a moving vehicle in a single pass.
The data is survey-grade. Not dashcam footage. Not commercial-grade photogrammetry. A measured, georeferenced point cloud tied to OS National Grid, accurate to 5mm, deliverable in the formats your design software and asset management system require.
Why mobile mapping changes what is possible on highways
To understand why mobile mapping matters, it helps to compare what it replaces. On a 1km section of live urban carriageway:
A static survey team with a total station — working safely on a live road with adequate traffic management — might cover 100–200 metres per day. A 1km corridor would take four to five working days, require sustained traffic management throughout, and expose the survey team to significant road risk for an extended period.
A mobile mapping survey of the same 1km corridor takes a single morning. One vehicle pass. Minimal carriageway presence. No extended traffic management. No prolonged exposure of personnel to live traffic. And the dataset is denser, richer and more complete than anything the static team would have produced in five days.
That is not a marginal efficiency improvement. It is a fundamental change in what is practical, what is safe, and what is affordable on a live highways programme.
Safety
Why Mobile Mapping Changes the Risk Profile of Highway Survey.
Why Mobile Mapping Changes the Risk Profile of Highway Survey.
The safety argument for mobile mapping is as compelling as the efficiency argument — and for programmes on live carriageways, it may be the more important one.
Reduced time in the hazardous zone.
No static personnel on the carriageway.
Static survey on a live highway requires traffic management — cones, signs, a stopped or slowed lane — and personnel positioned on or adjacent to the carriageway. Mobile mapping requires none of this. The survey vehicle moves with traffic, not against it. There are no static personnel on the road surface.
Reduced traffic management cost and disruption.
Full lane closures or contraflow arrangements for static highway survey are expensive, require advance notice, and create congestion and disruption that extends well beyond the immediate survey area. Mobile mapping requires minimal traffic management — in most cases, a standard sign vehicle or outrider is sufficient — reducing cost, reducing public disruption and reducing the programme lead-time for the survey operation.
Compliance with the Traffic Signs Manual and Chapter 8.
All our mobile mapping operations are planned in compliance with the Traffic Signs Manual Chapter 8 requirements for road worker safety. Method statements and traffic management plans are produced for every survey and approved before any operations on a public highway begin.
What mobile mapping delivers — the data package
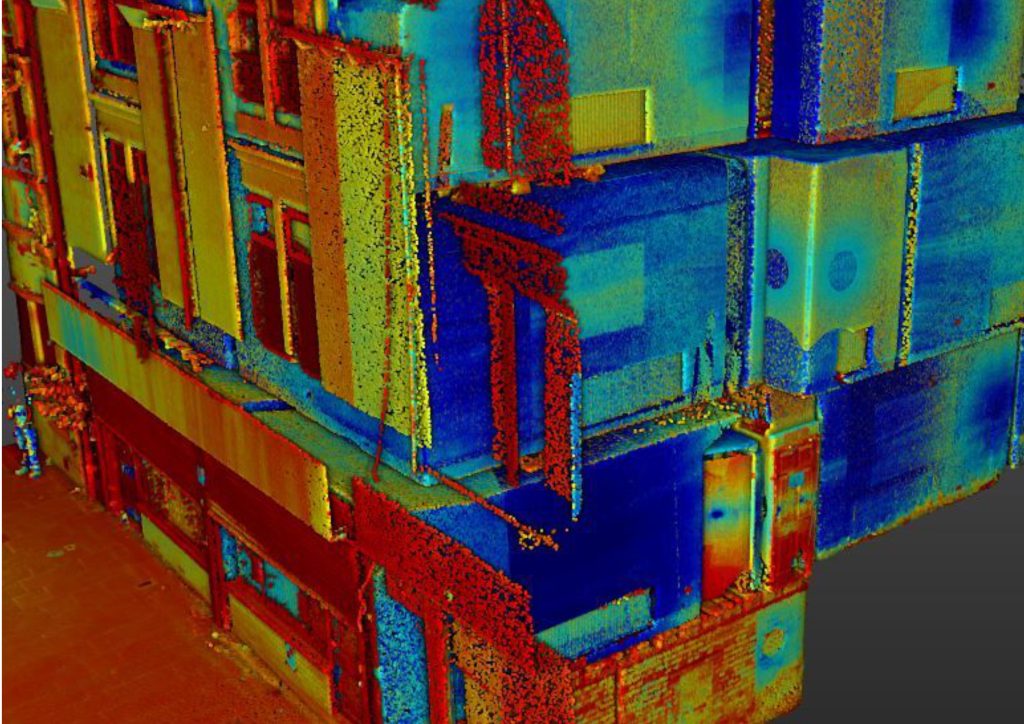
Dense 3D point cloud
The primary output — a complete, measurable 3D model of the survey corridor from verge to verge. Every feature captured, every level recorded, every dimension measurable in the office. LAS, LAZ or E57 format, georeferenced to OS National Grid.
Colourised point cloud
Panoramic imagery registered to the point cloud — a photorealistic 3D record of the corridor as it was at the time of survey. Usable for asset condition assessment, feature identification and visual inspection without site attendance. Street-level imagery combined with precise geometry.
Road surface geometry
Millimetre-accurate road surface data — lane markings, kerb lines, channel lines, drainage features, manhole cover positions, surface texture and visible defects at the resolution of the capture. The data that drainage designers, pavement engineers and highway designers need.
Georeferenced dataset
Every element of the output is tied to OS National Grid, making it directly usable in highway design, asset management and GIS environments without further registration or adjustment.
CAD deliverables
From the point cloud, our in-house team extracts the features your design team needs — highway cross-sections at specified chainages, longitudinal profiles, kerb lines, channel lines, drainage features, road markings, signs, boundaries and topographic features — in AutoCAD DWG or DXF format compatible with your design software.
Feature inventory
Visible service indicators including manhole covers, inspection chambers, meter boxes and duct markers.
Panoramic imagery
Full photographic record of the entire survey corridor, tied to the survey route with precise GPS positioning. Available as a navigable street-level record for asset inspection, condition assessment and change detection.
GIS-compatible output
All outputs available in formats compatible with QGIS, ArcGIS and highway asset management systems on request.
The CHCNAV AU20 Mobile Mapping System.
The CHCNAV AU20 Mobile Mapping System.
We operate the CHCNAV AU20 MMS — one of the most capable vehicle-mounted survey platforms available. Every specification decision matters on a live highway programme. Here is what the AU20 delivers and why it matters for your data.
Scanning rate — 2,000,000 pulses per second
Accuracy — 5mm, precision 3mm
=
Range — 1.5m to 250m
Automated VMA correction
Field of view — 360°
Dual-laser configuration
AI-enhanced colourisation — greater than 95% panoramic accuracy
IMU update rate — 600 Hz
Where mobile mapping is the right methodology
Highway corridor survey and road improvement schemes
The primary application. Long-distance survey of live highway corridors — for road improvement schemes, active travel routes, junction improvements and strategic highway surveys. Where a static survey team working on a live carriageway would need days with full traffic management, a mobile mapping run captures the same corridor in hours with minimal carriageway presence.
The data produced covers everything the highway design team needs — existing carriageway geometry, drainage, kerb lines, visibility splays, side road junctions, footway widths, lighting columns, signs, boundaries and all contextual features — in a single pass. One mobilisation. One dataset. Everything needed for the preliminary and detailed design.
Road asset management and network inspection
Local authorities, Highways England supply chains and infrastructure asset managers need to know the current condition of their road network — surface geometry, drainage condition, sign and marking visibility, street furniture inventory, footway condition — at a frequency and scale that static survey cannot support within maintenance budgets.
Mobile mapping captures all asset data simultaneously from a single survey run, producing a complete, up-to-date inventory of the network for the asset management system. The survey can be repeated annually or at agreed intervals — each run tied to the same control network, allowing direct comparison between survey dates to detect deterioration, asset loss and network change.

As-built road survey and verification
Following road reconstruction, resurfacing or improvement works, mobile mapping provides a rapid, accurate as-built record of the completed carriageway. Cross-sections, surface levels, lane marking positions, kerb lines and drainage features can all be verified against design drawings without extended site attendance or traffic management.
For programmes where as-built verification is a condition of payment — or where the highway authority requires survey evidence of completion to specification — mobile mapping delivers the verification record faster and more cost-effectively than any static methodology.
Pre-design corridor survey for transport and planning
Before a highway improvement or active travel scheme can be designed, the existing conditions need to be established in full. Mobile mapping captures the complete existing geometry of the corridor — road surface, verges, boundaries, structures, drainage, services at surface level, street furniture and adjacent land features — in a single survey operation.
For transport assessments, this includes road cross-sections, junction geometry, visibility splay measurement, footway widths and carriageway condition data in a single dataset. For planning submissions, the corridor context — building lines, access points, traffic signals and all physical features — is captured at the resolution that transport planners and highway designers require.
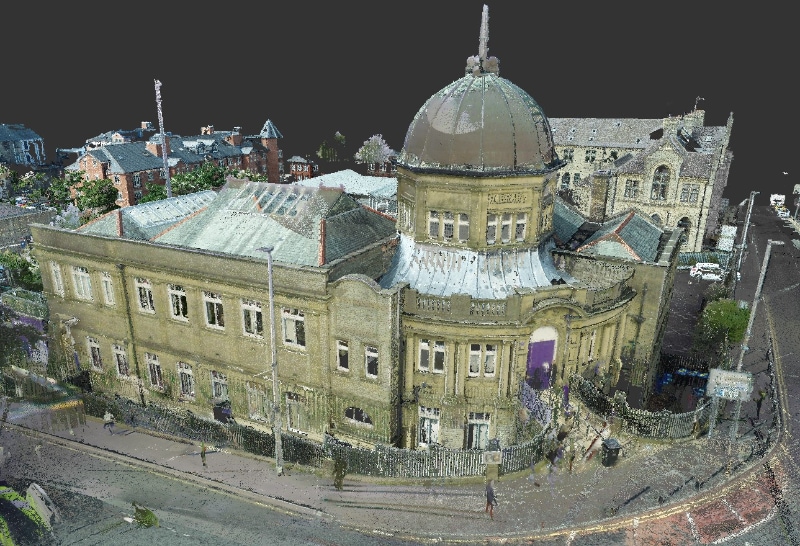
Urban street and townscape survey
Urban environments present particular challenges for conventional survey. Parked vehicles, street furniture, pedestrian activity, restricted access and the sheer volume of features to be captured make static survey in urban streets slow, expensive and disruptive. Mobile mapping solves all of these problems simultaneously — capturing the full streetscape, facades, footways, road surfaces and all street-level features from a single vehicle pass without pedestrian or traffic disruption.
For urban regeneration programmes, public realm improvement, active travel design and townscape assessment, mobile mapping is increasingly the standard methodology for existing condition capture.
Tunnel and confined corridor survey
The 250m range and 360° field of view of the AU20 make mobile mapping applicable in tunnel, underpass and confined corridor environments where static scan positions are limited by restricted access and complex geometry. Single-pass capture of the full tunnel geometry — invert, walls, soffit, drainage and structural features — in a single vehicle run without closing the asset.
Land Surveying Services
Mobile Mapping Surveys for Your Sector
What the Data Enables — Downstream Applications.
What the Data Enables — Downstream Applications.
The point cloud and photographic record produced by a mobile mapping survey is not a one-use dataset. The data captured in a single survey run supports multiple downstream applications simultaneously.
Design engineers extract cross-sections, profiles and feature data from the point cloud for preliminary and detailed design without returning to site.
The photographic record provides a contemporaneous record of traffic conditions, signal timings, queue lengths and conflict points for transport assessment.
The georeferenced point cloud integrates directly with highway BIM models and design software, providing the existing conditions layer for design coordination.
Repeat mobile mapping surveys tied to the same control network allow direct comparison between survey dates — detecting road surface deterioration, asset loss, vegetation encroachment and boundary change.
The timestamped, georeferenced photographic and geometric record provides a defensible existing conditions record for planning applications, highway stopping-up orders and legal disputes.
our Topographical survey case studies
BAE Systems — Barrow-in-Furness

Urban Regeneration Surveys — Darwen, Colne and Accrington
Our Services
How Mobile Mapping Surveys Integrate With Other Services
How Mobile Mapping Surveys Integrate With Other Services
Topographical Surveys
OS-controlled accurate, efficient and cost effective surveys for highways, civils and development. Cad and BIM-ready output.
PAS 128 utility mapping
Providing the location of underground services in 2D or 3D through qualified utility mapping surveys, using advanced GPR and Electromagnetic Location.
Measured building survey
Delivering accurate as-built information that supports design, refurbishment, planning and construction with the latest technology. Producing reliable drawings and digital models.
Laser Scanning
3D laser scanners capture millions of points per second, creating a point cloud which enables the finer details and the physical site to be viewed remotely.
Mobile mapping
For highway engineers, infrastructure managers, local authorities and contractors working on live road schemes, mobile mapping is now the standard for corridor surveys.
3D Machine control
With decades of supporting major earthworks contractors and large-scale infrastructure schemes, we provide reliable machine control across Lancashire and the wider UK.
Setting out engineers
With strong, long-standing relationships across the civil engineering and construction sector, we supply skilled professionals who keep your projects accurate, efficient and on programme.
bathymetric surveys & river surveys
Using modern technology, we capture detailed underwater and river channel information safely and efficiently – delivering reliable data you can trust.
Stockpile surveys & volumetric analysis
Whether a one-off stockpile measurement or regular monitoring, we deliver reliable, repeatable data tailored to your project using advanced technology.
Control Network Installation
Delivering robust and precise site control systems to support every stage of construction in developments, infrastructure schemes or major earthworks.
aerial & drone surveys
CAA-approved drone operations for aerial mapping, photogrammetry and volumetric analysis, providing a comprehensive view of terrain, structures and landscapes.
3D BIM Modelling
Whether you require an as-built Revit model, federated coordination model or detailed digital twin, our team delivers high quality, design-ready outputs.
survey equipment hire
We offer a vast range of surveying and engineering equipment for hire and will always try to beat a comparable quote. Discover the fleet.
monitoring
Providing reliable monitoring surveys across the UK, delivering precise data that supports risk management, compliance and informed decision making throughout a project lifecycle.
Virtual Tour 3D
An immersive experience which instantly transports your clients to your business, guiding them through your space and creating a seamless experience.
Impermeable area surveys
We deliver georeferenced impermeable area data that drainage engineers and planning consultants can work from directly.
CCTV & Drainage surveys
Acoustic & Noise Assessments
We deliver acoustic and noise assessments, supporting planning applications, discharge of conditions and Environmental Impact Assessments.
Topographical Surveys
PAS 128 utility mapping
Laser Scanning
Mobile mapping
Setting out engineers
bathymetric surveys & river surveys
Control Network Installation
aerial & drone surveys
survey equipment hire
monitoring
Impermeable area surveys
CCTV & Drainage surveys
3D Machine control
Acoustic & Noise Assessments
Stockpile surveys & volumetric analysis
3D BIM Modelling
3D BIM Modelling
Virtual Tour 3D
Why choose site surveying services
On site. On spec. On time.
One morning. One kilometre of live carriageway. No lane closure.
The CHCNAV AU20 captures the full corridor at road speed. No static personnel on the carriageway. No extended traffic management. The survey that would take five days on foot done before lunch.
2 million points per second. Everything captured.
Road surface, kerbs, drainage, signage, street furniture, boundaries, building facades — all within 250m of the vehicle, simultaneously, in a single pass. The complete existing conditions dataset from one run.
The same data. Multiple downstream uses.
Highway design, asset management, transport assessment, as-built verification — the same point cloud and panoramic record supports all of them. One survey. Multiple applications. No return visits.
Frequently Asked Questions
Frequently Asked Questions
What is mobile mapping survey?
Mobile mapping is vehicle-mounted survey — a system combining LiDAR scanners, panoramic cameras, GNSS receivers and an inertial measurement unit, mounted on a survey vehicle. As the vehicle travels at road speed, the system captures a continuous 360° point cloud and photographic record of the full corridor. The output is a dense, georeferenced 3D dataset of the survey corridor — captured from a moving vehicle without stopping, without traffic management and at a fraction of the time required by static survey methods.
How accurate is mobile mapping survey?
The CHCNAV AU20 MMS achieves 5mm accuracy and 3mm precision from a moving vehicle. This is survey-grade accuracy — equivalent to the standard specified for static topographic survey on highway design programmes. The AU20 achieves this through its high-precision GNSS system, 600 Hz IMU, and automated VMA correction, which maintains accuracy through complex urban environments and areas of GNSS signal interruption.
How does mobile mapping compare to traditional highway survey?
On a live carriageway, mobile mapping is significantly faster, significantly safer and produces a richer dataset than any static survey methodology. A 1km live highway corridor that takes 3–5 days for a static survey team — with full traffic management and extended personnel exposure on the carriageway — is captured in a single morning by the mobile mapping vehicle, with minimal carriageway presence and no static personnel on the road surface. The dataset produced is denser, has photographic colourisation and covers the full 360° corridor scene, rather than the discrete features captured by a traditional survey team.
What does a mobile mapping survey include?
A standard mobile mapping survey from Site Surveying Services delivers a dense 3D point cloud, colourised point cloud with panoramic imagery, road surface geometry data, a georeferenced dataset tied to OS National Grid, CAD extraction of required features and a panoramic photographic corridor record. Feature inventories for asset management and GIS-compatible outputs are available on request. All deliverables include a full methodology statement.
Does mobile mapping require traffic management?
Minimal traffic management is required for most mobile mapping surveys — significantly less than static survey on the same corridor. In most cases, a sign vehicle or standard advance warning signage is sufficient. Full lane closures are not required. The survey vehicle travels with traffic at road speed. Where specific road conditions, speed limits or operational requirements necessitate additional traffic management, we produce a traffic management plan as part of the pre-survey method statement.
Can mobile mapping survey replace a static topographic survey?
For highway corridor surveys, road asset management and as-built verification on live carriageways — yes, mobile mapping is the more appropriate methodology in most cases. For sites where detailed feature capture at high accuracy is required in confined spaces, inside buildings, on complex structures or on smaller sites where the efficiency advantages of mobile mapping do not apply — static topographic survey and laser scanning remain the right methodology. We advise on the appropriate methodology for your specific application at the time of scoping.
What file formats do you deliver mobile mapping data in?
Point cloud data is delivered in LAS, LAZ or E57 format as standard. CAD deliverables — cross-sections, profiles, kerb lines, drainage features and topographic plans — in AutoCAD DWG or DXF. Panoramic imagery tied to the survey route. GIS-compatible formats for asset management systems on request. Confirm your format requirements at the time of instruction and we will build them into the deliverable specification.
How long does a mobile mapping survey take?
The capture itself is rapid — at road speed, most highway corridor surveys are completed in a single day of field work regardless of corridor length. Processing the raw data to produce the final deliverables typically takes two to five working days depending on the size of the dataset and the deliverable requirements. We confirm the realistic programme at the time of quoting.
Do you cover the full UK?
Yes. Our head office is in Clitheroe, Lancashire, with offices in Matlock, Newcastle and Bristol. We deliver mobile mapping surveys across the North West, North East, Midlands and South West as primary territories, and nationally. All survey work is carried out by our directly employed team.